 IDG TETIS
Provided by
Type of resources
TETIS Keywords
gcmd Keywords
Topics
INSPIRE themes
Years
Scale
Resolution
Contact for the resource
-

The evolution of infrastructure networks such as roads and streets are of utmost importance to understand the evolution of urban systems. However, datasets describing these spatial objects are rare and sparse. The database presented here represents the road network at the french national level described in the historical map of Cassini in the 18th century. The digitalization of this historical map is based on a collaborative platform methodology that we describe in detail. These data can be used for a variety of interdisciplinary studies, covering multiple spatial resolutions and ranging from history, geography, urban economics to the science of network. (2015-01-15)
-

La densité de bâti est calculée par maille de 150 mètres de côté et sur la base d'une extraction du bâti à partir d'imagerie très haute résolution spatiale (1.5m) SPOT 6/7, pour les années 2015 à 2019.
-
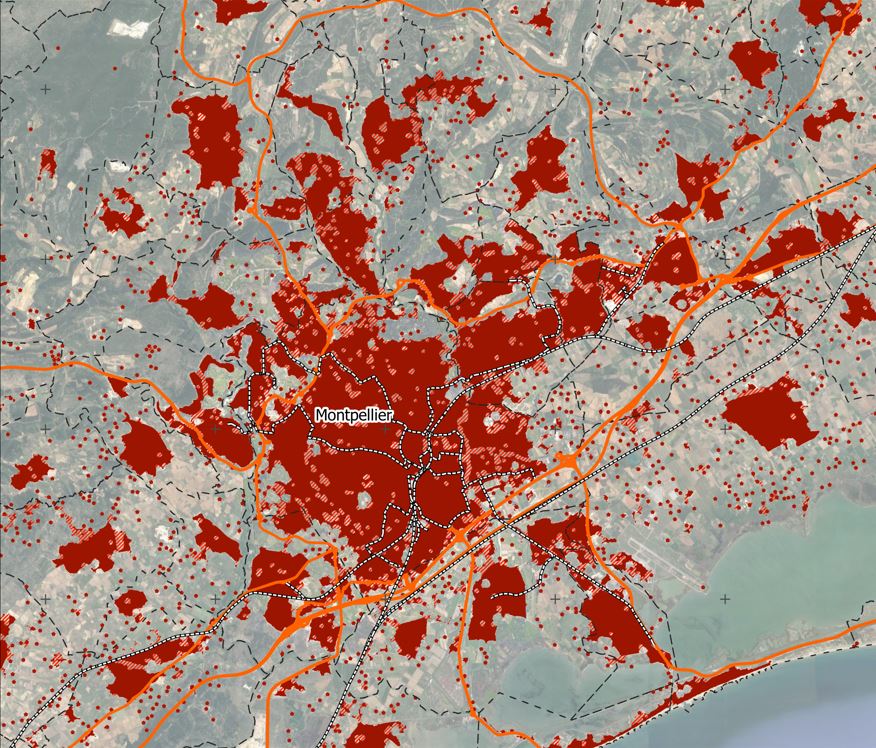
Les taches artificialisées sont calculées sur la base d'une extraction du bâti à partir d'imagerie très haute résolution spatiale (1.5m) SPOT 6/7, pour les années 2015 à 2019. Deux distances de connexion sont proposées, à 50m et 100m.
-

Le territoire régional est composé de taches urbaines de différentes tailles et formes, distribuées de manière variée. Les espaces urbains sont reliés les uns aux autres par le réseau routier, en particulier le réseau composé des routes primaires et secondaires. Cet espace urbain et routier ainsi composé est fortement artificialisé avec une forte composante d’imperméabilisation qui perdure au fil du temps. La dynamique spatiale et temporelle de cet espace peut être évaluée par les surfaces qui deviennent artificialisées, par la consommation des surfaces interstitielles, généralement agricoles ou naturelles. Ces surfaces à faible imperméabilisation, moins artificialisées, sont ainsi des îlots séparés les uns des autres par la trame urbaine et routière. Ces ilots sont de tailles variées et composent une structure fragmentée.Cet indice prend la forme d'une taille effective de maille, à savoir une grandeur qui exprime « la probabilité que deux points choisis au hasard dans un territoire [...] ne soient pas séparés par des obstacles tels que les voies de communication ou des zones bâties » (J. Jaeger, 2007).
-
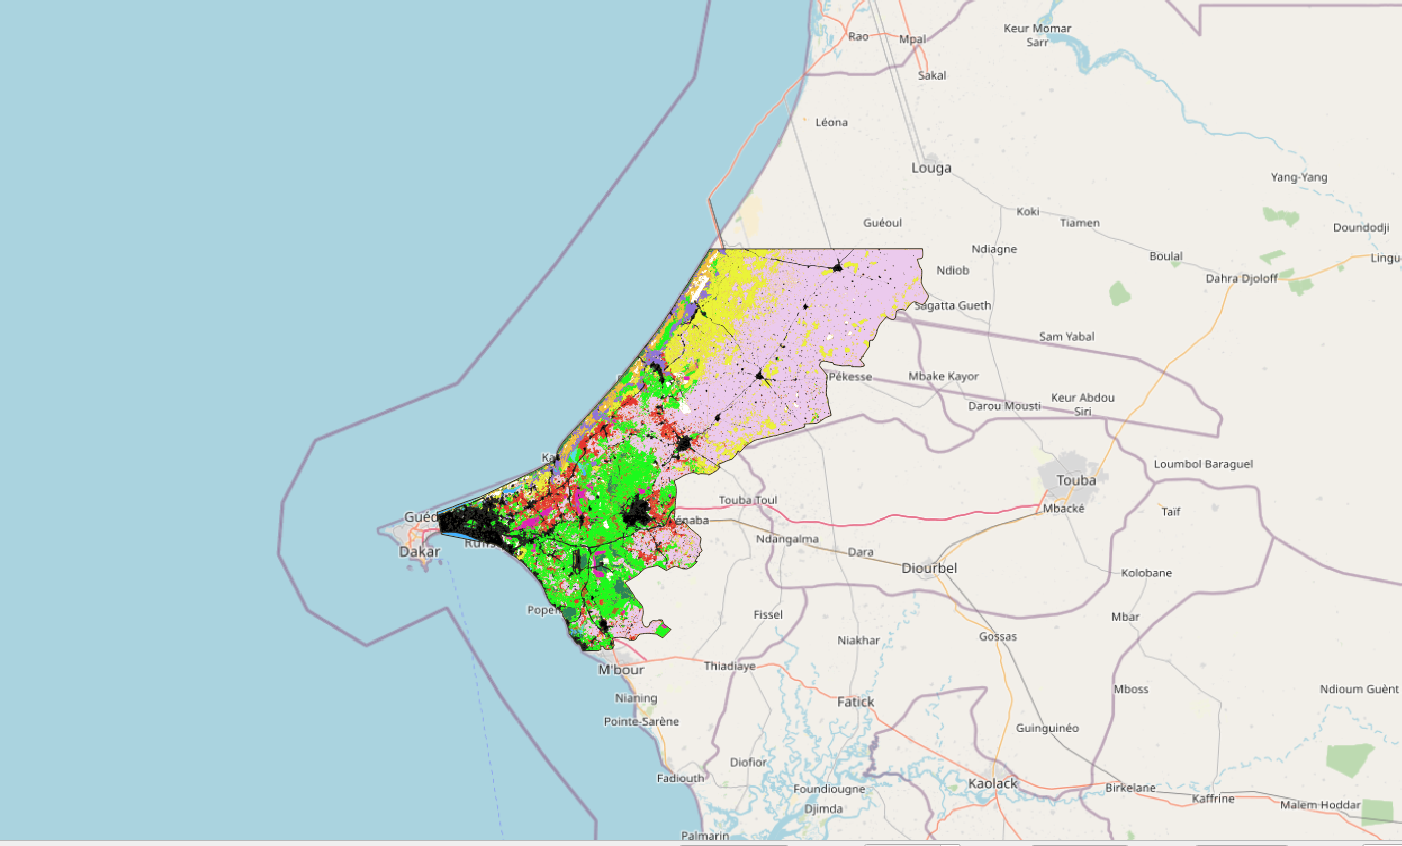
La zone d'étude se situe au nord ouest du Sénégal et s'étale sur 5 100km². Elle inclue la ville de Thiès et une partie de la ville de Dakar, et remonte jusqu'à Kébémer, aux portes du désert de Loumpoul. La carte d'occupation 2018 a été réalisée à partir d'une image à Très Haute Résolution Spatiale (THRS) à 1.5m Spot6 acquise le 15/10/2010 et une série temporelle d'images Sentinel2 (résolution 10m) acquises entre le 01/01/2018 et le 31/12/2018. Le traitement a été réalisé via la chaine de traitement Moringa développée dans l'UMR TETIS. La méthodologie s'appuie sur une Segmentation Orientée Objet de l'image THRS puis d'une classification de chaque polygone (algorithme Random Forest) s'appuyant sur l'image SPOT6, la série temporelle Sentinel2, le SRTM à 30m et de nombreux indices calculés à partir de ces images (NDVI, indices de texture, pente,...). L’algorithme a été entrainé via un jeu de données acquises sur le terrain complété de données obtenues par photo-interprétation. Des corrections manuelles par photo-interprétation ont été réalisées afin d'améliorer le résultat. La précision globale est de 93%. La classification contient 13 classes d'occupation du sol : culture irriguée hors bas-fond, culture irriguée de bas-fond, culture pluviale, plantation, dune sable - arbustes, eau, savane arbustive, savane herbacée, sol nu, sol inondable, sol faiblement végétalisé, végétation naturelle dense et zone urbaine.
-

Cette carte a été produite dans le cadre du projet FUI-2012 SIRHYUS (Services d'Information pour la gestion des Ressources HYdriques et de leurs USages) et a bénéficié d'une aide de l'Etat gérée par l'Agence Nationale de la Recherche au titre du Programme Investissements d'Avenir pour le projet EQUIPEX GEOSUD ANR-10-EQPX-20.
-

ObjectivesThe hyperspectral images (HI) is at the moment still too poorly considered; nevertheless its specificities make a weighty auxiliary for the monitoring of the elements of the urban area. The HYEP project has for objective to propose a panel of methods and processes designed for hyperspectral imaging. We take into account other existing sensors in order to compare the performances. If the IH is complementary to the sensors HRS and VHRS due to its better radiometric richness, it allows to identify and to characterize the natural or anthropogenic elements in a complementary perspective. To this end methods for the extraction of information had to be adapted, created even. The methodological part of the project articulated at the same time in the solidification of the current approaches and the design of new methods. Results have been presented along the project duration to scientific community and local authorities. One of the milestones of the works was the comparison of the results to various spatial resolutions to specify the contribution of such a hyperspectral sensor with regard to those existing or to come. Data and data processing Methods: existing or adapted The methods were chosen among all the existing methods by adapting them to the signal, among spectral ranges and to the characteristics of urban areas. Since data arose from airborne platforms, the first developments were realized to counter the effects of the atmosphere on the IH (atmospheric correction - 3 tested methods) and a database of spectral signature for diverse elements of land use in town (roofs, roads, the vegetation etc.) was established. It allowed encircling better the spectral values of materials. It was set up based simultaneously on the literature, in situ and laboratory measurements. Its contributions in various classification processing were tested. Methods for information, extraction, pansharpening or classification purposes were used for various spatial and spectral resolutions to highlight its interest towards other sensors and also its benefits for a spatial mission. Classification and unmixing methods have been adapted and spatial pattern indicators for urban areas defined.Outcomes- 3 atmospheric correction methods have been tested; it leads to a specific code development by ONERA.- Methods adaptation : pansharpening and unmixing- Transfer: a complete design of the study has been transfered to Kaunas (Lituania) teams- Algorithms: Depository on http://openremotesensing.net/- One of the major results is the extraction and the identification of photovoltaic panel- CNRS Summer school 2017Scientific productionThe team has presented at ISPRS Geospatial Week 2015, GeoHyper (2015), Jurse 2017, IGARSS 2016-2017, SFPT or workshops TEMU, AFIGEO and to GdR Session (MaDics and ISIS) or within the framework of the Hypxim mission. The team organized special conference sessions at the national level, SFPT hyperspectral (2016) and international level IGARSS 2018 and WHISPERS 2018. A thematic CNRS summer school (2017 August 28 - September 1st - 25 participants) has been set up.The project gave rise to 10 publications Rang A and 38 communications, 4 chapters and a special issue for the RemoteSensing journal.
-

This dataset provides georeferenced polygon vectors of individual tree canopy geometries for dryland areas in West African Sahara and Sahel that were derived using deep learning applied to 50 cm resolution satellite imagery. More than 1.8 billion non-forest trees (i.e., woody plants with a crown size over 3 m2) over about 1.3 million km2 were identified from panchromatic and pansharpened normalized difference vegetation index (NVDI) images at 0.5 m spatial resolution using an automatic tree detection framework based on supervised deep-learning techniques. Combined with existing and future fieldwork, these data lay the foundation for a comprehensive database that contains information on all individual trees outside of forests and could provide accurate estimates of woody carbon in arid and semi-arid areas throughout the Earth for the first time.
-
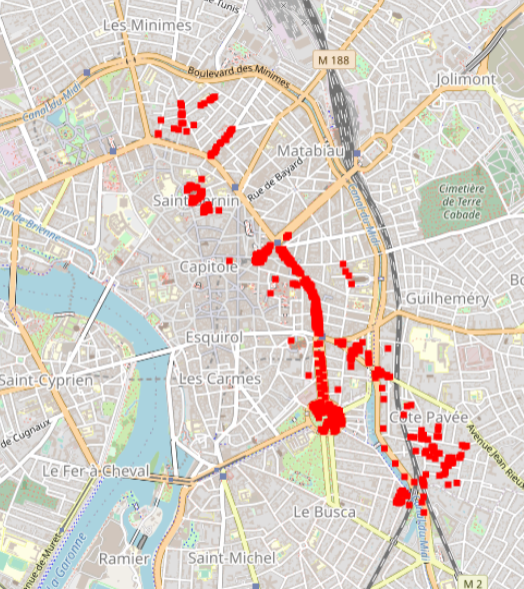
Hyperspectral data were obtained during an acquisition campaign led on Toulouse (France) urban area on July 2015 using Hyspex instrument which provides 408 spectral bands spread over 0.4 – 2.5 μ. Flight altitude lead to 2 m spatial resolution images. Supervised SVN classification results for 600 urban trees according to a 3 level nomenclature: leaf type (5 classes), family (12 and 19 classes) and species (14 and 27 classes). The number of classes differ for the two latter as they depend on the minimum number of individuals considered (4 and 10 individuals per class respectively). Trees positions have been acquired using differential GPS and are given with centimetric to decimetric precision. A randomly selected subset of these trees has been used to train machine SVM and Random Forest classification algorithms. Those algorithms were applied to hyperspectral images using a number of classes for family (12 and 19 classes) and species (14 and 27 classes) levels defined according to the minimum number of individuals considered during training/validation process (4 and 10 individuals per class, respectively). Global classification precision for several training subsets is given by Brabant et al, 2019 (https://www.mdpi.com/470202) in terms of averaged overall accuracy (AOA) and averaged kappa index of agreement (AKIA).
-

Cette donnée raster résulte d'une classification par méthode d'apprentissage profond à partir d'imagerie très haute résolution spatiale (1.5m) SPOT 6/7. Des post-traitements ont été effectués afin de mieux caractériser les classes relatives à l'artificialisation.