 IDG TETIS
Creation year
2022
18 record(s)
Provided by
Type of resources
TETIS Keywords
gcmd Keywords
Topics
INSPIRE themes
Years
Scale
Resolution
Contact for the resource
-

Cette carte a été produite dans le cadre du projet FUI-2012 SIRHYUS (Services d'Information pour la gestion des Ressources HYdriques et de leurs USages) et a bénéficié d'une aide de l'Etat gérée par l'Agence Nationale de la Recherche au titre du Programme Investissements d'Avenir pour le projet EQUIPEX GEOSUD ANR-10-EQPX-20.
-
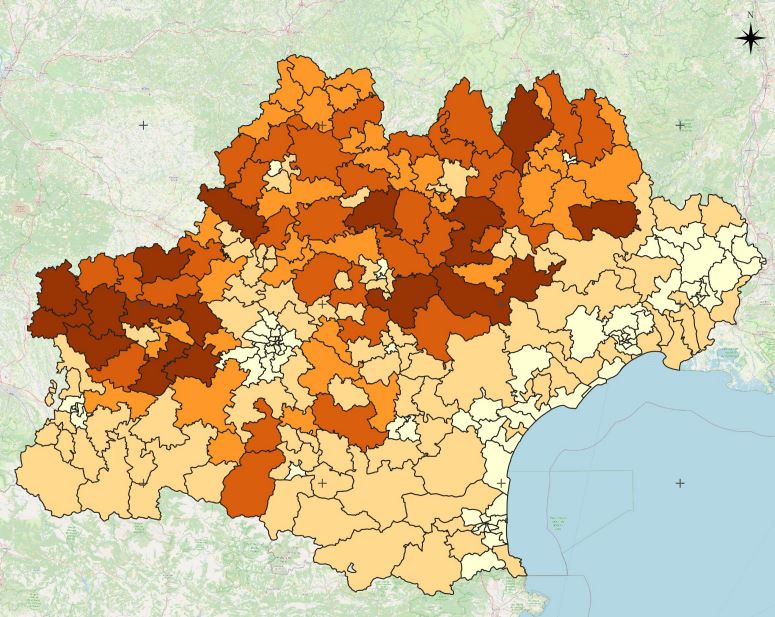
Les taches urbaines distribuées sont caractérisées par des formes très variées. Ces formes peuvent aller d’un aspect très compacte (proche d’un disque, forme de compacité maximale sur un plan) à celui de formes très digitées ou de filaments, s’approchant de lignes plus ou moins sinueuses. Le suivi de cette dimension de compacité morphologique permet d’estimer si l’artificialisation due aux taches urbaines suit des extensions homogènes ou des extensions hétérogènes. Cet indice est calculé à l'échelle des EPCI d'Occitanie et pour l'année 2019.
-
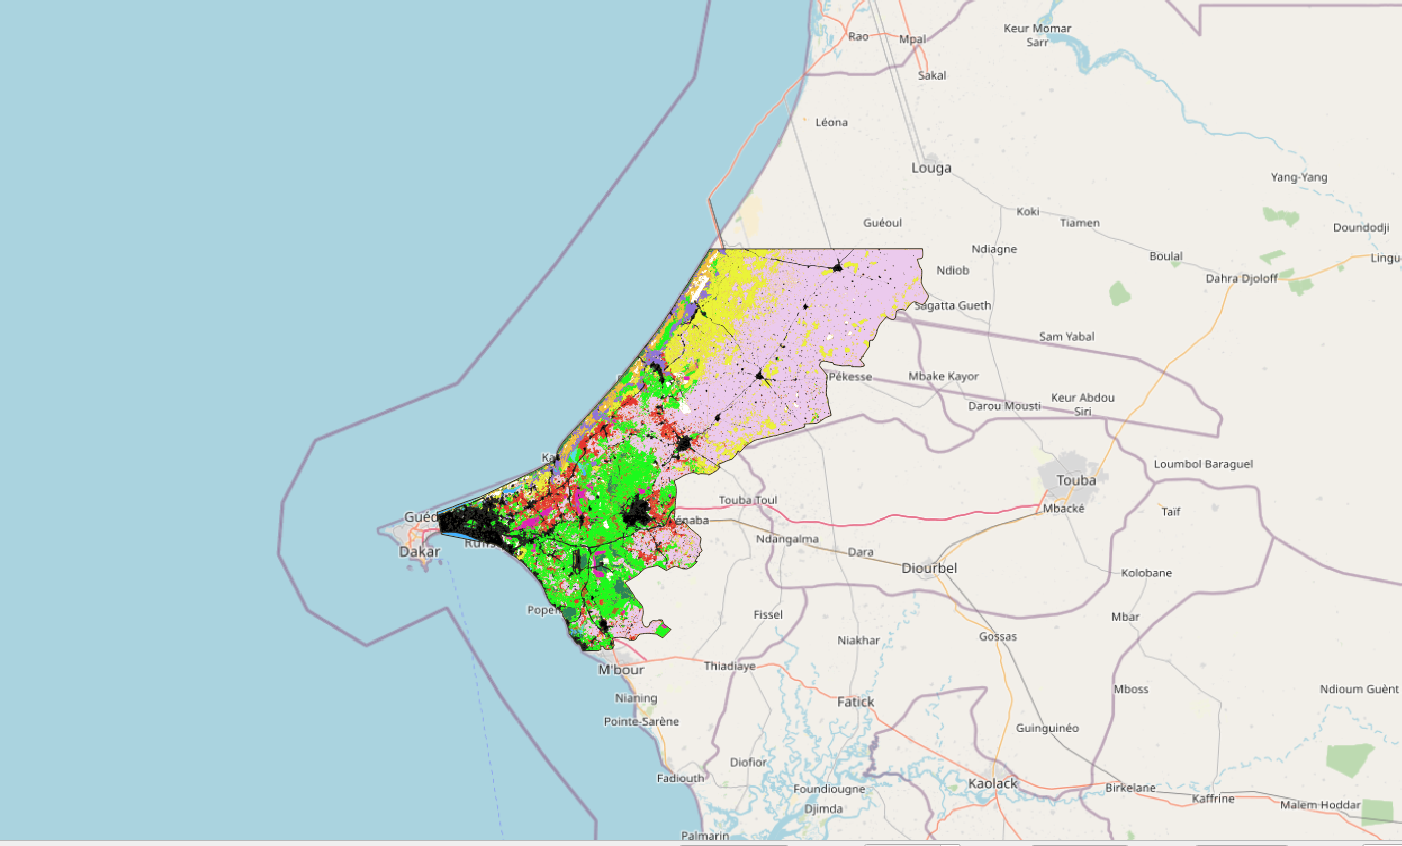
La zone d'étude se situe au nord ouest du Sénégal et s'étale sur 5 100km². Elle inclue la ville de Thiès et une partie de la ville de Dakar, et remonte jusqu'à Kébémer, aux portes du désert de Loumpoul. La carte d'occupation 2018 a été réalisée à partir d'une image à Très Haute Résolution Spatiale (THRS) à 1.5m Spot6 acquise le 15/10/2010 et une série temporelle d'images Sentinel2 (résolution 10m) acquises entre le 01/01/2018 et le 31/12/2018. Le traitement a été réalisé via la chaine de traitement Moringa développée dans l'UMR TETIS. La méthodologie s'appuie sur une Segmentation Orientée Objet de l'image THRS puis d'une classification de chaque polygone (algorithme Random Forest) s'appuyant sur l'image SPOT6, la série temporelle Sentinel2, le SRTM à 30m et de nombreux indices calculés à partir de ces images (NDVI, indices de texture, pente,...). L’algorithme a été entrainé via un jeu de données acquises sur le terrain complété de données obtenues par photo-interprétation. Des corrections manuelles par photo-interprétation ont été réalisées afin d'améliorer le résultat. La précision globale est de 93%. La classification contient 13 classes d'occupation du sol : culture irriguée hors bas-fond, culture irriguée de bas-fond, culture pluviale, plantation, dune sable - arbustes, eau, savane arbustive, savane herbacée, sol nu, sol inondable, sol faiblement végétalisé, végétation naturelle dense et zone urbaine.
-

L'atlas cartographique offre un aperçu des données produites et traitées dans le cadre du projet Artisols. Ce dernier, soutenu par la Région Occitanie et le Fonds Européen de Développement Régional (FEDER), s’inscrit dans une démarche d’évaluation et de qualification du processus d’artificialisation des sols en région Occitanie.Neuf grandes thématiques y sont développées : - Les bâtiments résidentiels et d’activité- L’occupation du sol - La densité de bâti par maille de 150 m de côté - L'évolution de la densité de bâti entre 2017 et 2019- Les taches urbaines - La densité de bâti au sein des taches urbaines- Le coefficient de dispersion- L'indice de fragmentation des espaces non artificialisés- L'indice de compacité des taches urbaines
-
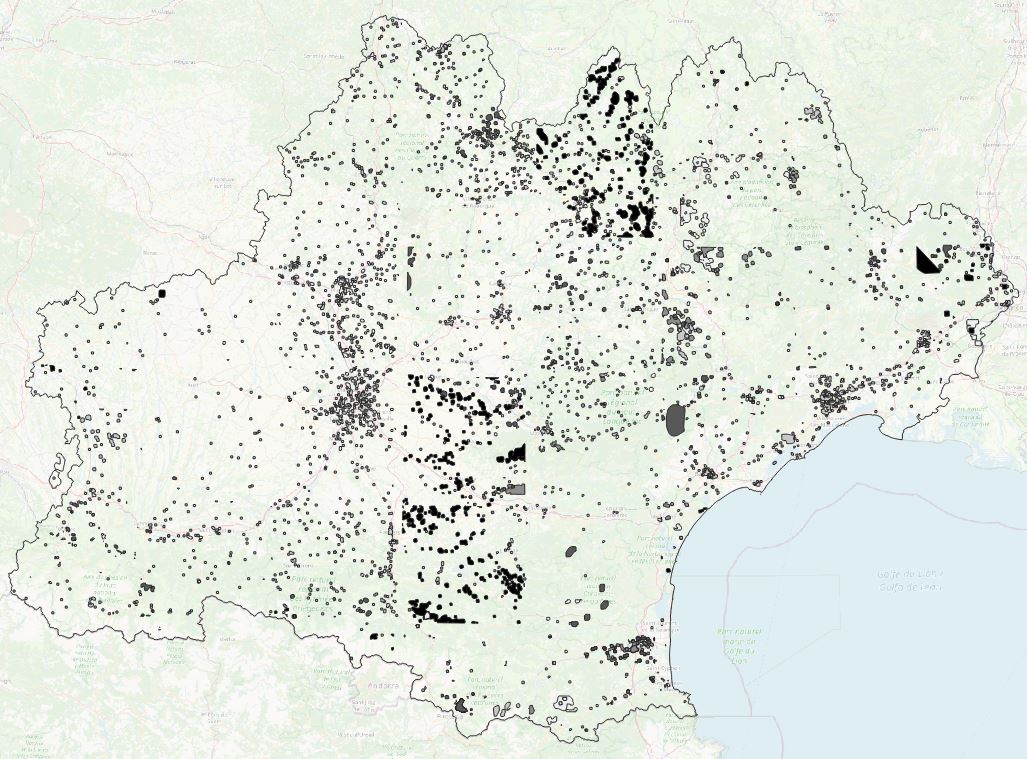
Les données de nodata par année (entre 2015 et 2019) correspondent aux zones de nuages et de leurs ombres portées sur les images satellites SPOT 6/7 utilisées pour la classification d'occupation du sol, donnée source pour les analyses géographiques qui ont suivi (extraction des espaces bâtis, des taches urbaines, indicateurs spatialisés)
-

Cette donnée raster résulte d'une classification par méthode d'apprentissage profond à partir d'imagerie très haute résolution spatiale (1.5m) SPOT 6/7. Des post-traitements ont été effectués afin de mieux caractériser les classes relatives à l'artificialisation.
-
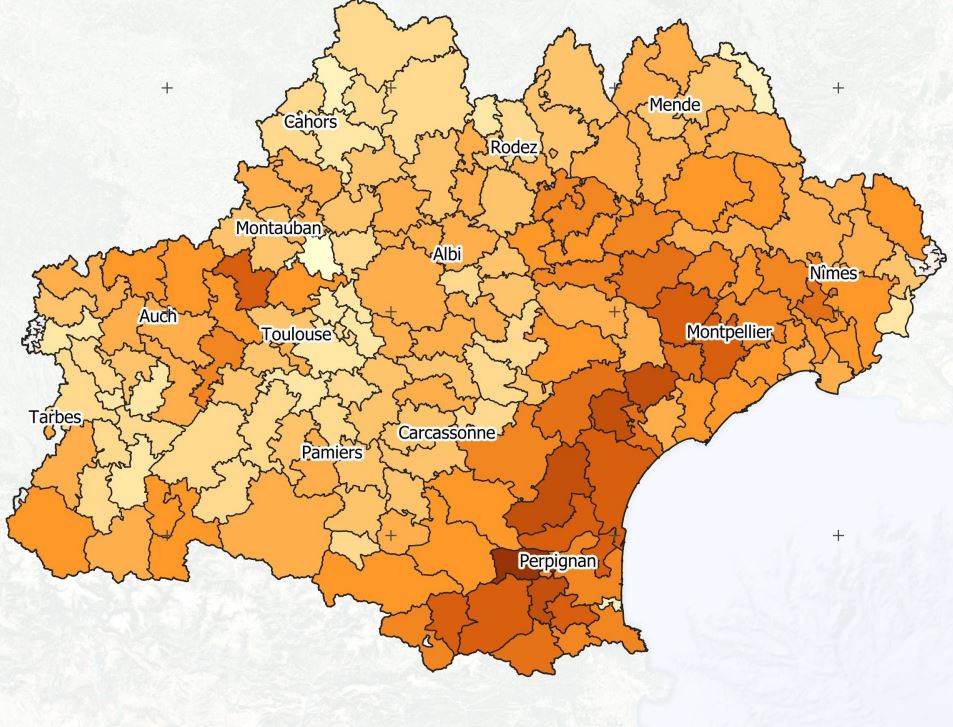
Le coefficient de dispersion représente le rapport entre la surface des espaces artificialisés (taches urbaines) morcelés, définis ici pour une emprise inférieure à 3 hectares, et celle des espaces artificialisés denses supérieurs ou égales à 3 hectares.Cet indicateur a été calculé par canton et pour les années 2015 à 2019.
-

The evolution of infrastructure networks such as roads and streets are of utmost importance to understand the evolution of urban systems. However, datasets describing these spatial objects are rare and sparse. The database presented here represents the road network at the french national level described in the historical map of Cassini in the 18th century. The digitalization of this historical map is based on a collaborative platform methodology that we describe in detail. These data can be used for a variety of interdisciplinary studies, covering multiple spatial resolutions and ranging from history, geography, urban economics to the science of network. (2015-01-15)
-
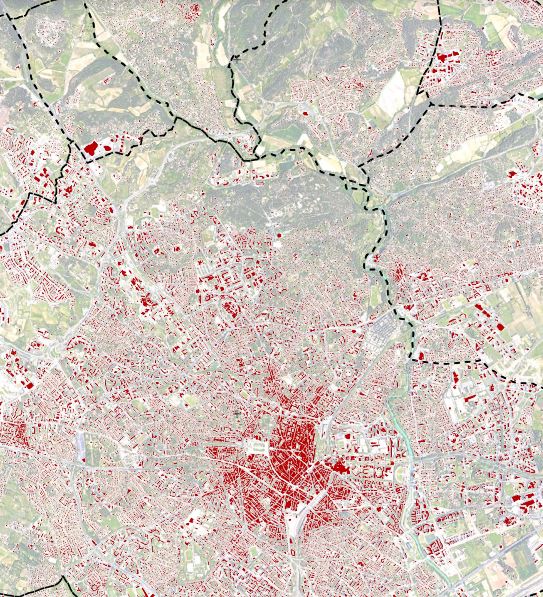
Les cartographies des espaces bâtis sur la région Occitanie résultent d'une extraction automatique par méthode d'apprentissage profond (deep learning) à partir d'imagerie très haute résolution spatiale (1.5m) SPOT 6/7, pour les années 2015 à 2019. Fichiers fournis sous forme vectorielle. (2021-09-09)
-

La densité de bâti est calculée par maille de 150 mètres de côté et sur la base d'une extraction du bâti à partir d'imagerie très haute résolution spatiale (1.5m) SPOT 6/7, pour les années 2015 à 2019.